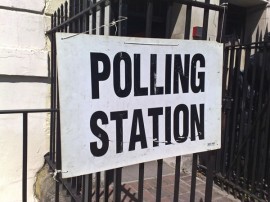
In the light of the forthcoming referendum on replacing First Past The Post with Alternative Vote for general elections, an interesting seminar yesterday looked at what difference it might have made to the result of the general election earlier this year. Of course, there is a strong hypothetical element to this – parties would have campaigned differently and voters might well have voted differently if the rules of the election had been different – but nevertheless there are some useful lessons to be learned.
Professor David Sanders of the University of Essex presented an alternative version of the general election result if it had been held under AV, with second and subsequent preferences being allocated on the basis of research that asked people how they would have cast such votes if the system allowed it. (Read a detailed analysis here.)
The distribution of second preferences of course varied according to the first preference, and was as follows (taking only electorate in Great Britain and not Northern Ireland, where a different political party structure applies):
| Labour 2nd | Conservative 2nd | Liberal Democrat 2nd | other 2nd | |
| Labour 1st | – | 7% | 63% | 30% |
| Conservative 1st | 7% | – | 53% | 40% |
| Liberal Democrat 1st | 40% | 25% | – | 35% |
| other 1st | 23% | 28% | 26% | 23% |
On this basis, the general election result under AV would have seen the Conservatives get 22 seats fewer (284 in total), Labour 10 seats fewer (248), and the Liberal Democrats 32 seats more (89).
(The result would have been slightly more proportional, relating votes cast to seats won. However, this considers only first preference votes, and there is an extensive and complicated discussion that one could have about whether this was the right way to take votes into account. Should a value be placed on second and subsequent preferences, too?)
Professor Colin Rallings, of the University of Plymouth, reported on the experience of elections conducted under AV in Australia and elsewhere, in which second preference votes were not used as extensively as either theory or the recommendations of political parties suggested. In fact, in quite a high proportion of cases – sometimes as much as a third – people cast only a first preference, even though they were entitled to cast further preferences and would not help the chances of their first preference by withholding later ones. In effect, this collapses the system back into FPTP.
Re-running the data (1), but with greater scepticism about the number of people who will cast second and subsequent preferences (bearing in mind that it is rare that the third preference matters and extremely rare that the fourth one does), produces the following picture:
| Basic model of AV | quite sceptical (2) | very sceptical (3) | FPTP result | |
| Conservative | 284 | 290 | 295 | 306 |
| Labour | 248 | 255 | 254 | 258 |
| Liberal Democrat | 89 | 76 | 72 | 57 |
| other | 29 | 29 | 29 | 29 |
We see that the fewer people use their second preferences, the more similar the result becomes to FPTP. Overall, no more than 32 seats, or 5 per cent of the total, have a different outcome from that under FPTP. Is that difference worth fighting a referendum for? The Conservatives would remain the largest party, Labour second and the Liberal Democrats third, so the pecking order among the parties remains the same, too.
But look at the combined total of Labour and Liberal Democrat seats. Under FPTP, it was only 315, but under AV it rises to 337, which is to say more than the 326 needed to form a majority in the House of Commons. So, far from a Conservative/Liberal Democrat coalition being the only available majority after the election, a Labour/Liberal Democrat coalition would also have been possible. The post-election negotiations could therefore have been very different.
So, far from changing very little, as it seemed at first sight, the difference between AV and FPTP would have changed everything. From the point of view of the parties, there is a lot at stake in the referendum next May.
¤ ¤ ¤
The 1997 Labour manifesto included a commitment to doing something about the electoral system. Over 13 years in government, they didn’t do it and instead settled for the status quo. There is a sweet irony that, had they fulfilled their own manifesto commitment, they might now still be in government and not in opposition.
Notes
(1) Recalculations by Colin Rallings and Michael Thrasher, University of Plymouth, from an original analysis by the British Elections Study team at the University of Essex.
(2) assuming Con and Lab 35% give a first preference only, all others 25%
(3) assuming Con and Lab 50% give a first preference only, all others 35%
